ForumIAS announcing GS Foundation Program for UPSC CSE 2025-26 from 27th May. Click Here for more information.
Contents
| For 7 PM Editorial Archives click HERE → |
Introduction
Recently, Niti Aayog released the poverty estimates using the Multi Dimensional Poverty Index (MDPI). Multidimensional poverty measurement approach has been promoted by the UNDP. This method reflects a shift from traditional monetary measures to a holistic view of poverty. Measuring poverty in India has always been multifaceted. So, there is need to explore the different methods utilized and discuss the hurdles encountered in accurately assessing poverty levels in India.
What are various approaches to poverty measurement?
Monetary Measures (Income and Consumption)
Consumption-based Approach: This method measures poverty based on how much people spend on consumption. In India, poverty has traditionally been estimated this way, with data collected from consumption expenditure surveys conducted every 5 years. For example, based on consumption data, expert committees like those led by Lakdawala, Tendulkar, and Rangarajan have drawn “poverty lines” that separate the poor from the non-poor.
Income-based Approach: In this approach poverty is assessed by determining the amount of money required for a subsistence diet or a minimum standard of living. While this method is more direct, in countries like India, income data are hard to collect.
Multidimensional Approach (‘Capabilities’ or ‘Deprivations’ based)
The multidimensional approach offers a more comprehensive view of poverty, looking beyond just income or consumption. It measures deprivations across multiple dimensions like health and nutrition, education, and standard of living.
While the consumption and income-based methods provide direct financial measures of poverty, the multidimensional offers a holistic view, capturing a wider range of deprivations. Different countries and organizations might prefer one method over the other based on their data availability and the dimensions of poverty they prioritize.
What are the shortcomings/challenges in the approaches to poverty measurement?
Challenges of Monetary measures (Income and Consumption)
Income Approach
There are difficulties in assessing the incomes of self-employed people, daily wage labourers, etc. Apart from this, large fluctuations in income due to seasonal factors, additional side incomes, and data collection difficulties in the largely rural and informal economy of India are other issues with this approach.
Consumption Approach
Subjectivity of Poverty Line: The poverty line, established by expert committees over the years, segregates the poor from the non-poor based on the consumption expenditure. However, setting this line can be subjective and might not accurately reflect the diversity of living conditions across regions.
Price Variations: The cost of essential items varies across regions. Consumption approach does not always account for these price differentials, leading to inconsistencies in poverty assessment. For instances, there’s been a growing gap between consumption estimates from National Accounts Statistics (NAS) and National Sample Survey (NSS) data. This discrepancy, which has been widening over time, is a concern.
Lack of Updated Data: India hasn’t had official consumer expenditure data post-2011-12, making direct comparisons challenging. The 2017-18 survey data hasn’t been officially released, leading to indirect methods and diverse conclusions on poverty trends.
Challenges of Multidimensional Poverty Index (MPI)
Holistic but complex: MPI offers a broader view of poverty by considering factors beyond just income, such as health, education, and standard of living. For example, India’s MPI measures deprivations in 12 variables, including maternal health and bank account access, in contrast to the Global MPI’s 10 variables.
Comparability issues: India’s adaptation of the MPI differs from the Global MPI. The inclusion of two additional variables in India’s MPI (maternal health and bank account) can create challenges in making direct comparisons.
Data Availability, Comparison and Aggregation: Data for parameters like like child mortality are not available at household level but for groups (like at District or State level). There are challenges in aggregating data e.g., data related to parameters like access to clean drinking water and child mortality can’t be aggregated together.
How is poverty measured in India?
Poverty measurement in India has been multifaceted.
Monetary Measures: Consumption Expenditure
Historically, India utilized a monetary approach to measure poverty. Dadabhai Naoroji’s 1901 book, “Poverty and Un-British Rule in India,” proposed measuring poverty based on the income needed for a subsistence diet.
Planning Commission Task Force (1977): A framework for calculating poverty was laid out in task force report from 1979. It chose to base its estimation on the NSS Consumer Expenditure Survey due to the limited data alternatives available at the time.
Consumption Expenditure: The income approach was refined into consumption expenditure surveys conducted every 5 years, which captured the expenditure habits of individuals.
Poverty Line: Over the years, several expert committees have shaped the definition of the “poverty line”. Committees like those led by D T Lakdawala (1993), Suresh Tendulkar (2009), and C Rangarajan (2014) have played significant roles. Notably, the Planning Commission Task Force in 1977 also contributed to defining the poverty line.
The last official poverty figures for India are from 2011. The 2017-18 consumption expenditure survey was discarded due to indications of reduced rural consumption, hinting at a rise in extreme poverty. Lacking recent consumption data, economists have used other data sources, such as NFHS or the Centre for Monitoring Indian Economy (CMIE), to estimate poverty levels.
Multidimensional Poverty Index (MPI)
Niti Aayog’s MPI provides a broader perspective on poverty, probing deprivations across health and nutrition (nutrition, child and adolescent mortality, maternal health), education (years of schooling and attendance), and standard of living (cooking fuel, sanitation, drinking water, housing, electricity, assets and bank account).
Global vs. Indian MPI: India’s MPI, influenced by the Global MPI designed by OPHI and UNDP, incorporates 12 variables, two more than the Global MPI. These additions are maternal health and bank account ownership.
What has been the trend of poverty in India?
In July 2013, based on the Tendulkar poverty line, Planning Commission released poverty data for 2011-12. The number of poor in the country was pegged at 269.8 million or 21.9% of the population. After this, no official poverty estimates in India have been released.
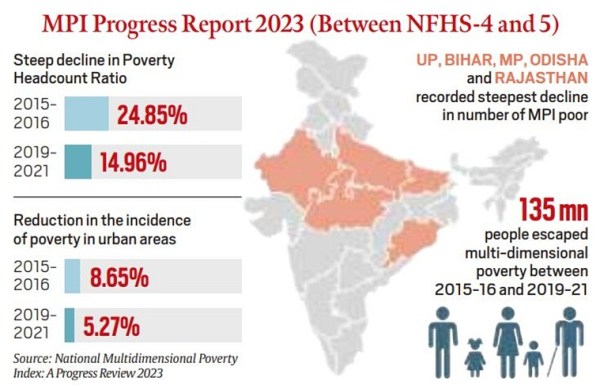
Transitioning to the Multidimensional Poverty Index (MPI) approach, there was a noted decline in poverty rates. As per the report published by NITI Aayog in July 2023, between NFHS-4 (2015-16) and NFHS-5 (2019-21), the multidimensional poverty rate reduced from around 25% to just under 15%. This implies that 135 million (or 13.5 crore) Indians moved out of multidimensional poverty during this period.
Source: Indian Express
The Global MPI 2023 report revealed that from 2005-06 to 2019-21, an impressive 415 million people in India transitioned out of poverty. Delving deeper, 270 million out of these individuals moved out of poverty between 2005-06 and 2015-16.
Middle-Class Evolution: Private research by People Research on India’s Consumer Economy (PRICE) in 2021 categorized 196 million Indians as ‘Destitutes’, 432 million as ‘Middle Class’, and 732 million as ‘Aspirers’.
What should be done ahead?
Clear Definition of Middle Class: While there’s a significant number of people rising out of poverty, it’s vital to clarify what ‘middle class’ means in India. Recent data from the People Research on India’s Consumer Economy (PRICE) survey segmented households based on annual income, categorizing ‘Middle Class’ between Rs 5 lakh to Rs 30 lakh. A standardised definition can help create targeted policies.
Regular Updating of Consumption Data: India’s last official poverty data is from 2011. The consumption expenditure survey of 2017-18 was discarded due to its indication of a decline in rural consumption. Regular updates are crucial to understand real-time poverty dynamics.
Inclusion of Diverse Metrics: The difference between the Global MPI and India’s MPI, like the inclusion of maternal health and bank account variables, suggests that a country-specific approach is beneficial. More such locally relevant metrics can make poverty measurement more comprehensive.
Broaden the Dialogue: Due to the uncertainty around the data, especially the consumption data, there is a need to widen the discussion about poverty. Collaboration with think tanks, like the Centre for Monitoring Indian Economy (CMIE), could offer alternate data sources.
Cross-check with Traditional Measures: Despite the advancements in measuring poverty, it’s essential to periodically compare new data with traditional measures like the ones proposed by D T Lakdawala, Suresh Tendulkar, and C Rangarajan. Such comparisons can provide a holistic view.
Strengthen Socioeconomic Infrastructure: To sustain the trend of poverty reduction, India should further invest in health, education, and standard of living improvements, areas measured by the MPI.
Source: Indian Express, The Hindu, Mint